An On Grid Solar System connects rooftop panels to the utility network, supplying daytime electricity while drawing power from the grid when production falls. Its appeal is clear: fewer moving parts than an off-grid setup, and no battery required for basic operation. But “best” depends on the roof, local electricity rates, export compensation, and household consumption. There is no universal winner. Not even close.
The market is expanding rapidly. IRENA’s Renewable Capacity Statistics 2025 reports that solar added approximately 452 gigawatts of capacity worldwide in 2024, helping drive a record year for renewable power growth. That scale brings more equipment choices, but it does not make every panel or inverter suitable for every home. A system facing morning shade may perform differently from one with an unobstructed south-facing roof. Small details matter. Inverter efficiency, monitoring quality, warranty terms, and access to qualified installation support deserve close attention. An on-grid system also typically shuts down during a grid outage unless it includes specifically designed backup equipment. This surprises some buyers. The comparison that follows examines system components, performance, costs, and practical trade-offs, using industry data and real-world selection criteria. Some estimates still vary by region, and that uncertainty deserves a candid look.
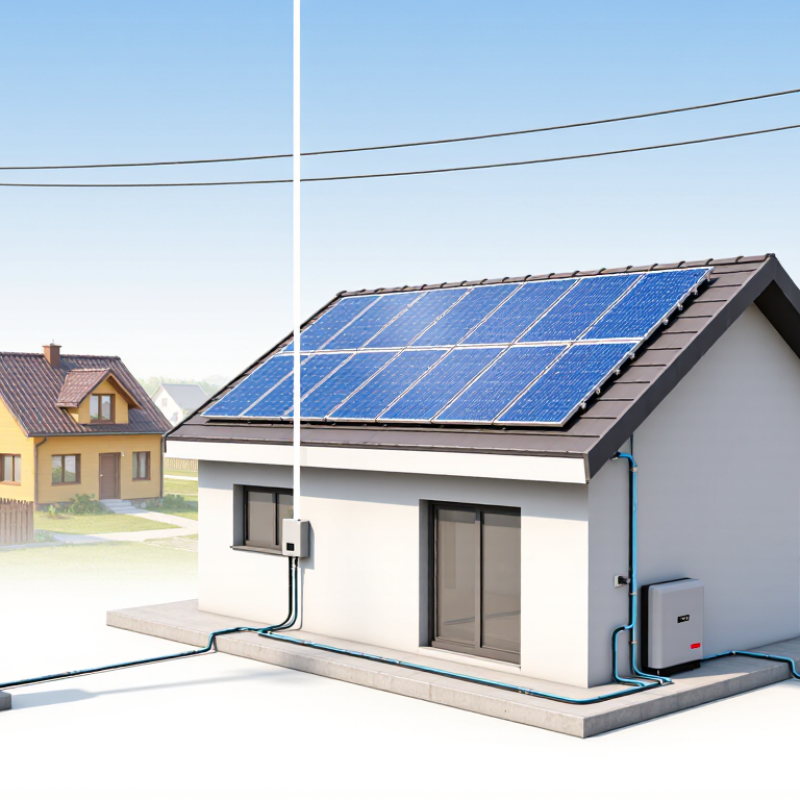
An on-grid solar system connects rooftop panels to a building’s electrical system and the local utility grid. Sunlight makes the panels produce direct-current electricity. An inverter converts it into alternating current, which household appliances can use. The refrigerator may draw solar power at noon, while lights and other loads use the same supply. Simple in principle.
When panels produce more electricity than the home needs, the excess may flow to the grid. At night or during cloudy periods, the home can draw electricity back from the utility. How exported power is credited depends on the local tariff and connection terms, so projected savings should use actual bills and site conditions. Most standard on-grid systems do not store energy. No sun, no rooftop production.
A key detail is outage protection. Many grid-connected inverters shut down during a power cut, even when the sun is shining. This helps prevent electricity from feeding into lines that workers may be repairing. A battery-ready or hybrid system with approved backup equipment can provide power to selected circuits, but that is a different setup. It is easy to overlook this limitation when comparing system sizes. For 2026, the best fit depends less on a headline panel rating and more on roof shade, daytime consumption, utility rules, and whether backup power matters.

A modern grid-tied solar system is more than panels on a roof. Modules convert sunlight into direct current, while an inverter changes it into grid-compatible alternating current. In NREL’s PVWatts model, the default inverter efficiency is 96%, and the default DC-to-AC sizing ratio is 1.2. These are modeling assumptions, not promises for every home. Real output depends on heat, shade, wiring, and system design. Small details matter.
Mounting rails secure the modules, and electrical protection equipment helps isolate faults or shut down the system when needed. A bidirectional meter records electricity flowing to and from the grid; monitoring software can reveal falling output before it becomes obvious on a bill.
The IEA PVPS Snapshot 2024 reported roughly 447 GW of new solar capacity worldwide in 2023, underscoring how quickly grid integration is expanding.
Yet a large market does not make every installation equally reliable. Ask how the installer accounts for roof orientation, local grid requirements, and inverter replacement over time. A neat cable run is reassuring. It is not a performance guarantee. I would also question a design that looks perfect on paper but leaves little room for future maintenance.
Evaluating an on-grid solar system in 2026 starts with your roof, not its advertised wattage. Check the direction and pitch, then note when nearby trees shade the panels. Ask for an hourly or monthly production estimate using local weather data. A single annual figure can hide weak winter output or afternoon shading. Small details matter.
Compare the forecast with your electricity use and the system’s export limit. NREL’s PVWatts documentation uses default assumptions of 14% system losses and 96% inverter efficiency. These are modeling inputs, not promises. Ask the installer to explain any major differences from your estimate, including shading, heat, wiring, and inverter clipping. I would also check monitoring access, equipment warranties, and who handles service. A neat payback number can mislead.
Scale provides context, not a quality score. The IEA PVPS report Trends in Photovoltaic Applications 2024 estimated that global solar capacity reached about 1.6 terawatts in 2023, with roughly 447 gigawatts added that year. For your own system, compare expected annual generation against recent bills, not a generic national average. Confirm whether the design shuts down during a grid outage; standard grid-connected systems generally do, unless configured with suitable backup equipment. Read the assumptions twice. One overlooked shade line can change the estimate.
Choosing the best on-grid solar system in 2026 starts with matching system size to real household use. Berkeley Lab’s Tracking the Sun 2024 report puts the median US residential system at about 7.4 kW for 2023 installations. That is a reference point, not a prescription. A home with afternoon air-conditioning, an electric vehicle, or shaded roof sections may need a different design. Compare annual electricity use with a roof-specific production estimate, not just the system’s rated capacity.
Inverter choice changes how the system handles shade and maintenance. A central string inverter is often simpler, while module-level inverters can help limit the effect of shade on individual panels. The trade-off is extra equipment on the roof. Ask for estimated annual output, component warranties, and replacement assumptions in writing. Small details matter.
Panel technology deserves a careful comparison, too. IEA PVPS’s Trends in Photovoltaic Applications 2024 reports that crystalline silicon accounts for about 98% of the global module market. Within that broad category, compare warranted output, dimensions, and performance in high temperatures. Higher rated power alone may not fit a narrow roof well. It depends. And estimates are still estimates; request the assumptions behind them, including roof orientation, shading, and local weather data.
The best on-grid solar system is the one that fits your home’s actual usage, roof, and utility arrangement. Start with twelve months of electricity bills, not a neighbor’s panel count.
The U.S. Energy Information Administration’s Electric Power Annual reports average residential use of about 10,791 kWh in 2022, or roughly 899 kWh monthly. Your home may differ sharply.
Small details matter. Note when you use power, too. A household running air conditioning on sunny afternoons can use solar energy directly; evening-heavy use may rely more on grid imports.
The National Renewable Energy Laboratory’s PVWatts model estimates production using location, system size, roof tilt, and orientation. Use it to compare realistic layouts, then ask an installer to check local shading and roof conditions. A cloudy winter week can change the picture.
Match system output to annual use, but treat full bill offset as a starting point, not a promise. Export credits and electricity rates vary by utility, and they affect the value of extra panels.
Check inverter sizing, warranties, and projected monthly production. An on-grid system usually shuts down during a power outage unless designed with suitable backup equipment. That detail is easy to miss.
Keep some allowance for imperfect estimates; actual production will not follow a tidy spreadsheet.

Cepex is the brand for the fluid handling market belonging to the Fluidra group. One of the leading european manufacturer of valves and fittings in thermoplastic materials.
Dedicated to the swimming pool, irrigation and industrial markets, we distribute our products worldwide with the Fluidra commercial network and presence in 46 countries with 136 sales branches.